
Dynamic Scenario Models with Claude: Interactive Dashboards, Excel Plugin, and Live Sensitivity Analysis

The most expensive moment in any finance meeting is when someone asks “what if?”
What if we raise prices 10%? What if churn doubles? What if the Fed cuts twice this year?
The old answer: “Let me get back to you.”
You’d go back to your desk, manually update 14 cells across 6 linked sheets, hope nothing broke, re-run the charts, and send a new file 48 hours later. By then the moment had passed.
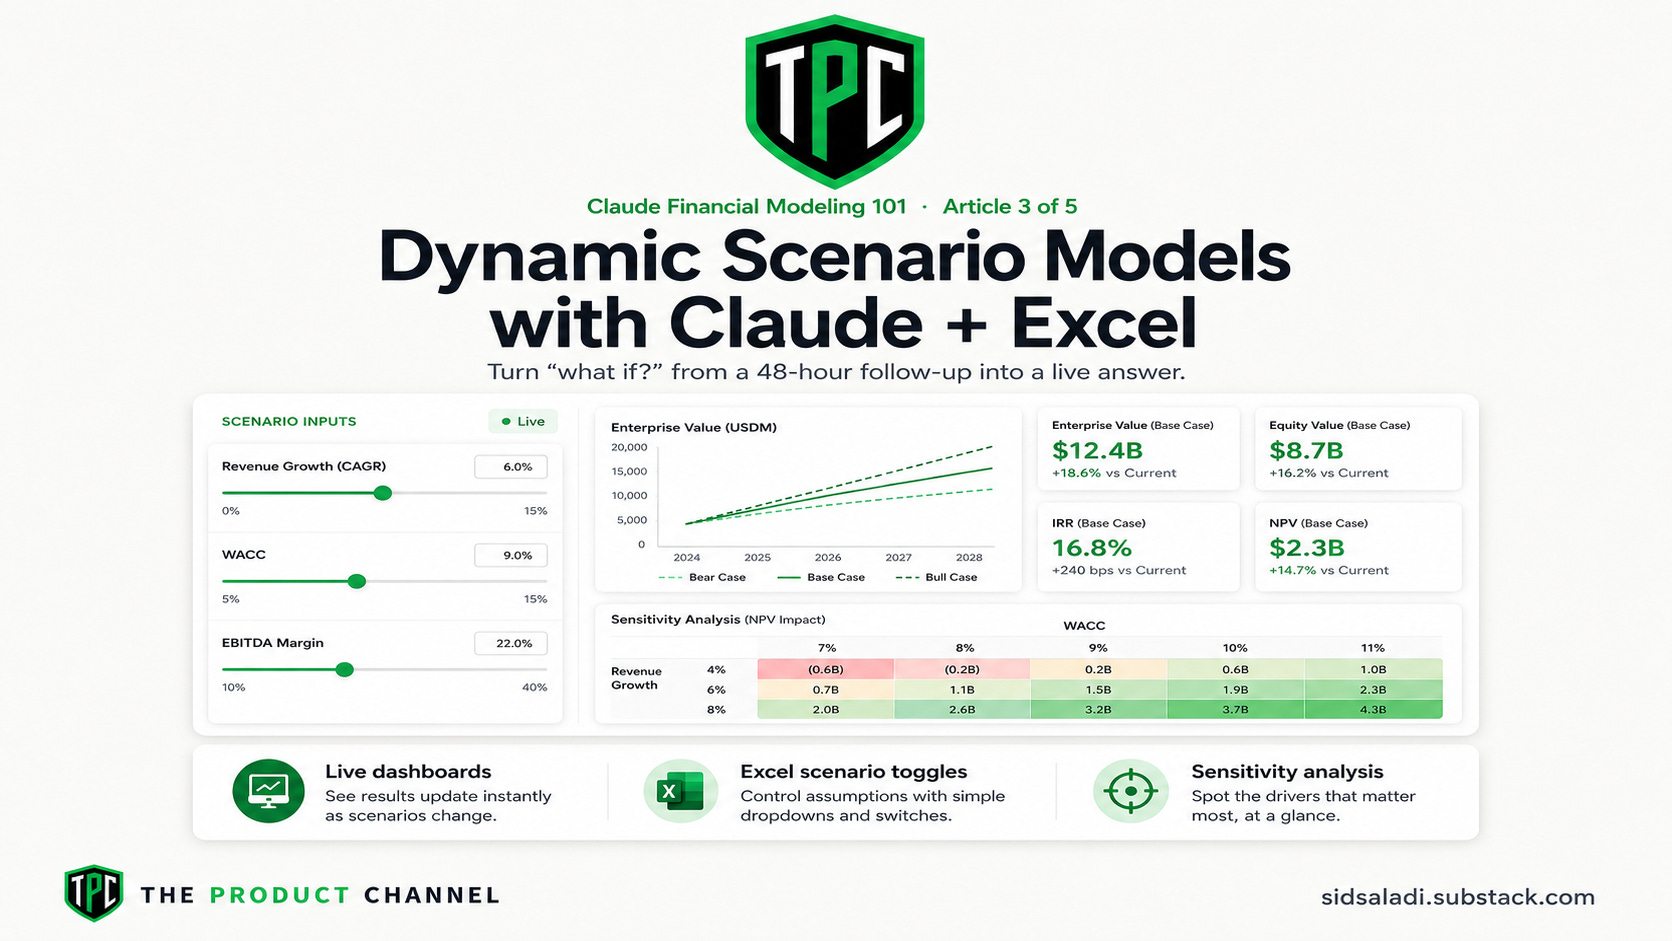
The new answer: you change one input. The model updates in real time. You have the answer before they finish the sentence.
This is Article 3 of 5 in The Product Channel’s Financial Modeling with Claude series. Today we build the scenario infrastructure: interactive in-browser dashboards, Excel-native scenario toggles, and the Claude in Excel plugin workflow.
If you haven’t read Articles 1 and 2, start with them— this builds directly on top of that foundation.
📬 Article 4 drops next week — 100+ finance prompts organized by use case. Don’t miss it.
Three Scenario Tools, Three Different Jobs
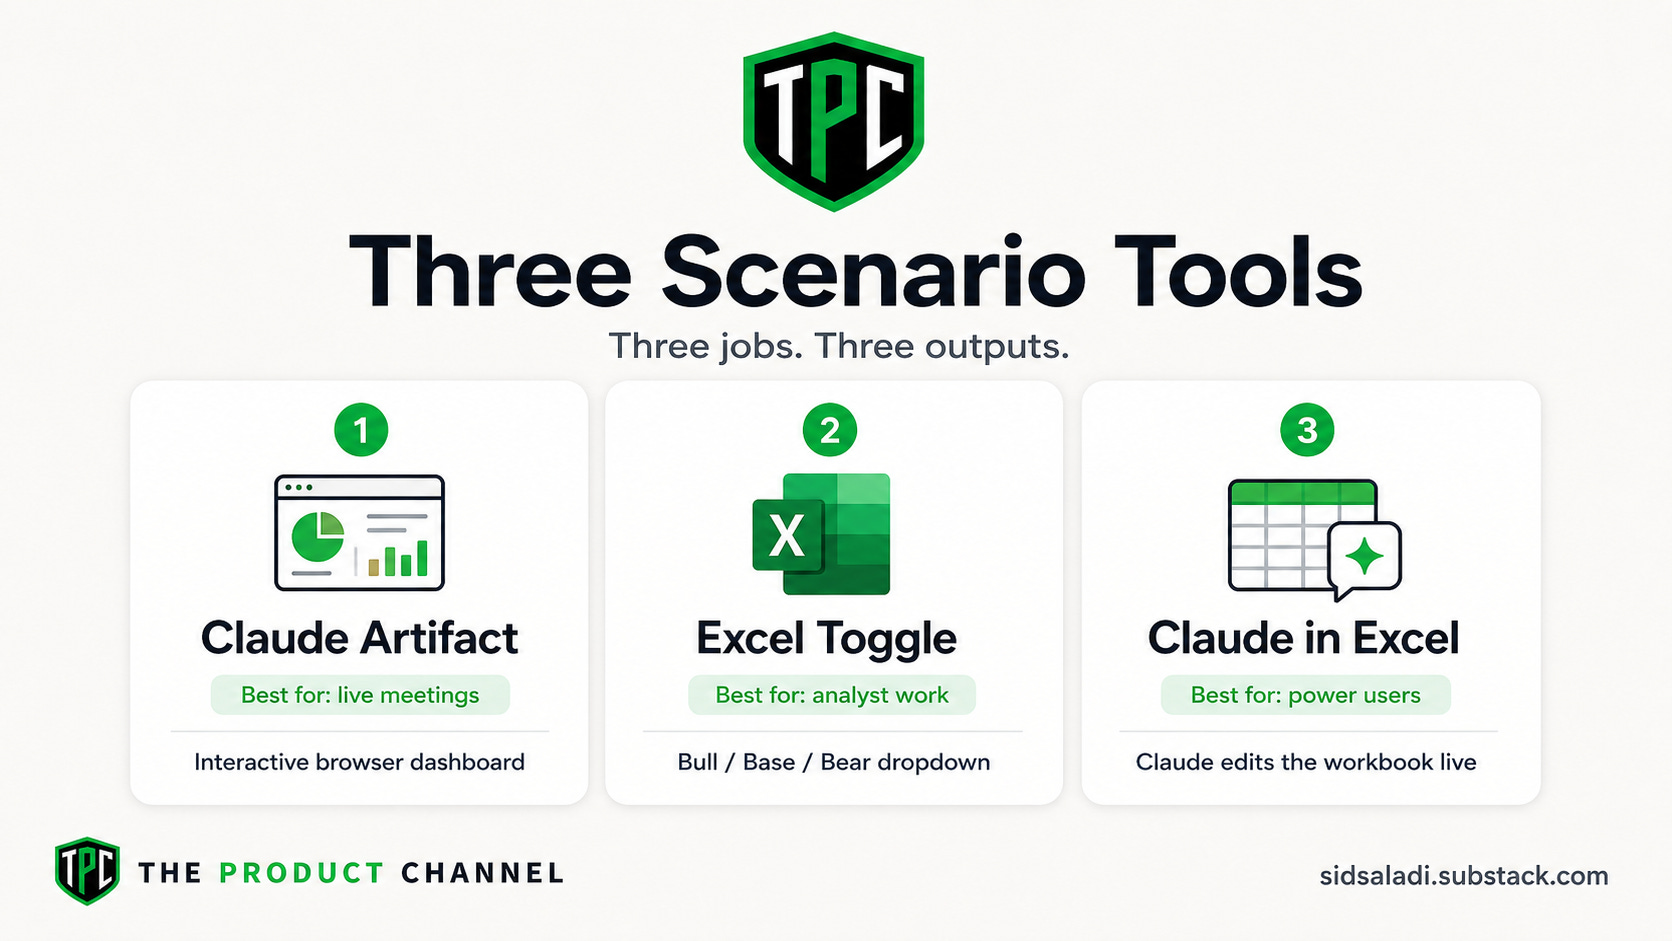
Before diving in, let me be clear about what each tool is actually for.
Tool 1: Interactive Claude Artifact (in-browser) Best for presentations, client meetings, sharing non-Excel users. You build a mini web app with sliders and dropdowns. Share a link. Anyone can play with assumptions in real time.
Tool 2: Excel Scenario Toggle (downloadable) Best for internal analyst work. Three named scenarios (Bull/Base/Bear) selectable via a dropdown. Every cell in the model updates instantly when you switch. Standard deliverable format.
Tool 3: Claude in Excel Plugin Best for power users who live in spreadsheets. Claude works directly inside your Excel file — typing into cells, building formulas, adding tabs. Requires Claude Team or Enterprise plan.
Use all three. They serve different audiences and different stages of the work.
Method 1: Build an Interactive Scenario Dashboard in Claude
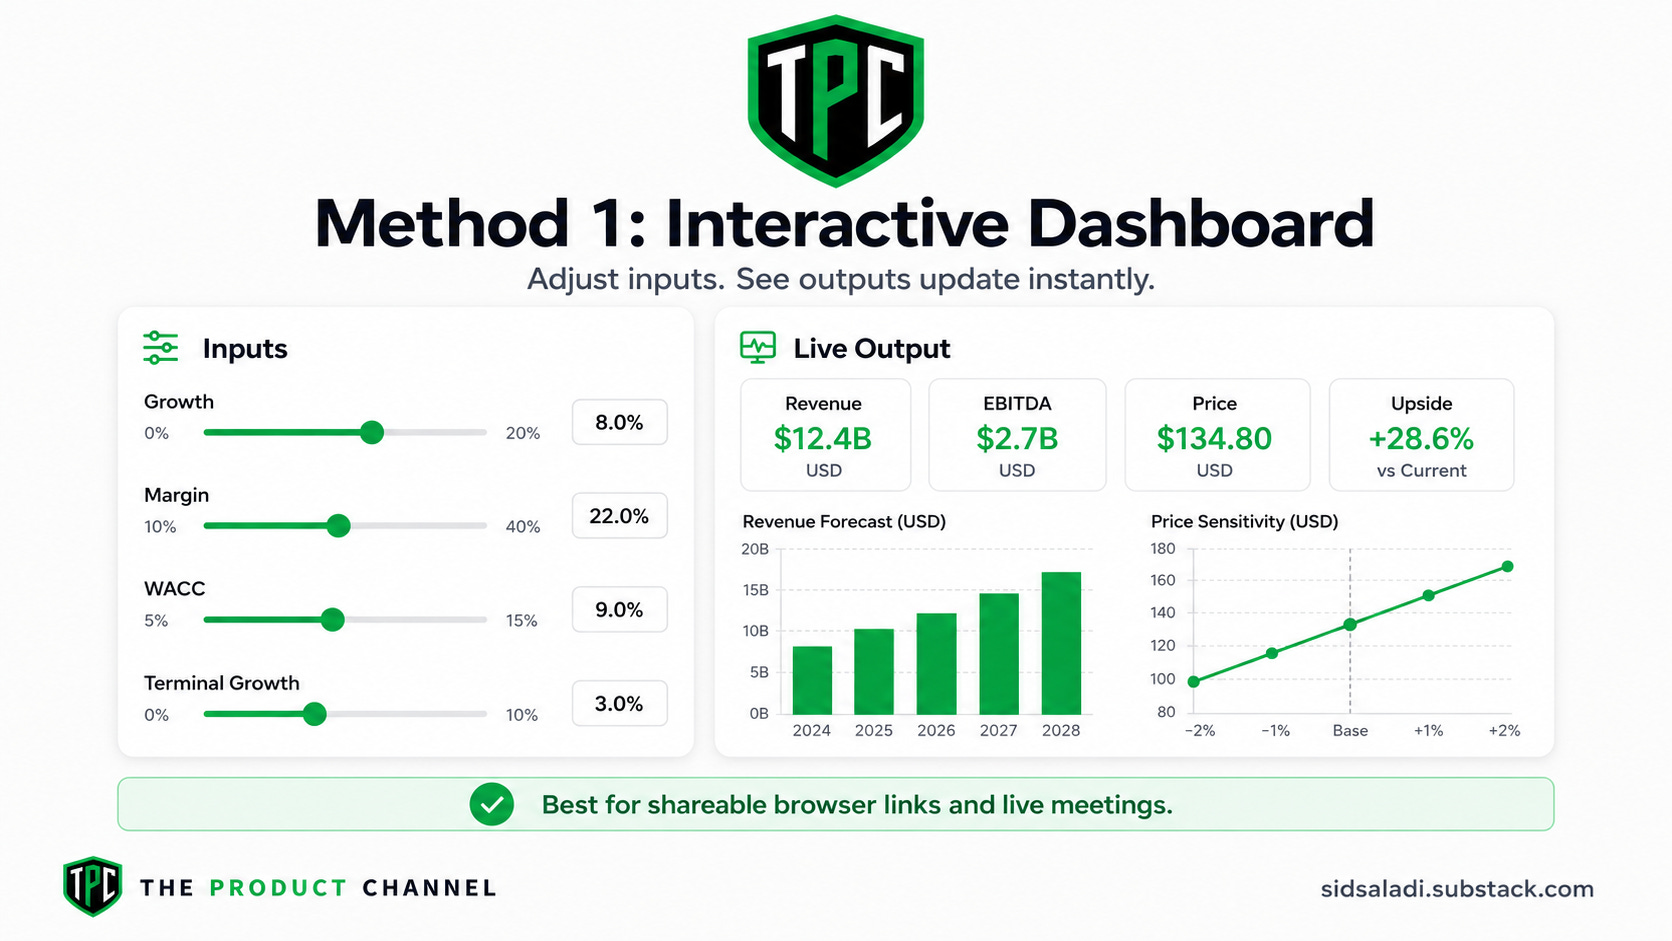
This is the fastest to build and the most impressive to show in a meeting.
The output is a fully interactive web app that runs inside Claude’s artifact panel. Sliders, dropdowns, live charts. You can publish it as a link — anyone with the URL can open it in a browser and adjust assumptions in real time.
The Prompt
Start a new conversation inside your financial model project (the one with your 10-K documents uploaded). Then run this:
Build an interactive scenario planning dashboard for [Company]
as a Claude artifact. Use the financial model we've developed
in this project as the data source.

LAYOUT:
Left panel (30% width): Assumption inputs
Right panel (70% width): Output charts and KPI summary

ASSUMPTION INPUTS (all adjustable via sliders or number inputs):
Revenue Section:
- Total revenue growth rate: slider, -10% to +25%, step 0.5%
- Services revenue growth premium: slider, 0% to +10% over total growth
- Gross margin (Products): slider, 30% to 50%
- Gross margin (Services): slider, 60% to 80%

Cost Section:
- R&D as % of revenue: slider, 5% to 15%
- SG&A as % of revenue: slider, 5% to 12%
- Effective tax rate: slider, 15% to 30%

Valuation Section:
- WACC: slider, 6% to 14%
- Terminal growth rate: slider, 1% to 4%
- Target EV/EBITDA multiple: slider, 15x to 35x

SCENARIO TOGGLE:
- Three preset buttons: Bull Case | Base Case | Bear Case
- Each button loads a predefined set of assumptions
- Active scenario highlighted in blue

OUTPUT CHARTS (update in real time as inputs change):
1. Revenue forecast bar chart (5 years, stacked by segment)
2. Margin trajectory line chart (Gross / Operating / Net, 5 years)
3. FCF generation bar chart (5 years)
4. Implied share price summary: show price from (a) DCF,
   (b) EV/EBITDA multiple, (c) current consensus —
   with color coding: green if above current price, red if below

KPI SUMMARY BOX (top of right panel):
- FY+3 Revenue ($M)
- FY+3 EBITDA ($M)
- FY+3 Net Income ($M)
- FY+3 FCF ($M)
- Implied Share Price (DCF)
- Upside / (Downside) vs. current price

Use [Company]'s current share price of $[X] for the upside calc.

Color scheme: professional, dark blue headers, white background,
teal accent for charts. Mobile-friendly layout.
Swap in the actual current share price before running — Claude can’t look that up in real time unless you have web search enabled.
What You Get
A fully interactive mini-application. Change the WACC slider from 9% to 11% and watch the DCF implied price drop in real time. Switch from Bull to Bear Case and see all charts repaint simultaneously.
The share this externally step: In the Claude artifact panel, click “Share” in the top-right corner. You get a public URL. Send it to your PM, your client, your investment committee. They open it in a browser. They can move sliders. They don’t need a Claude account.
This is genuinely one of the most powerful things you can do in a meeting.
Method 2: Excel Scenario Toggle Model
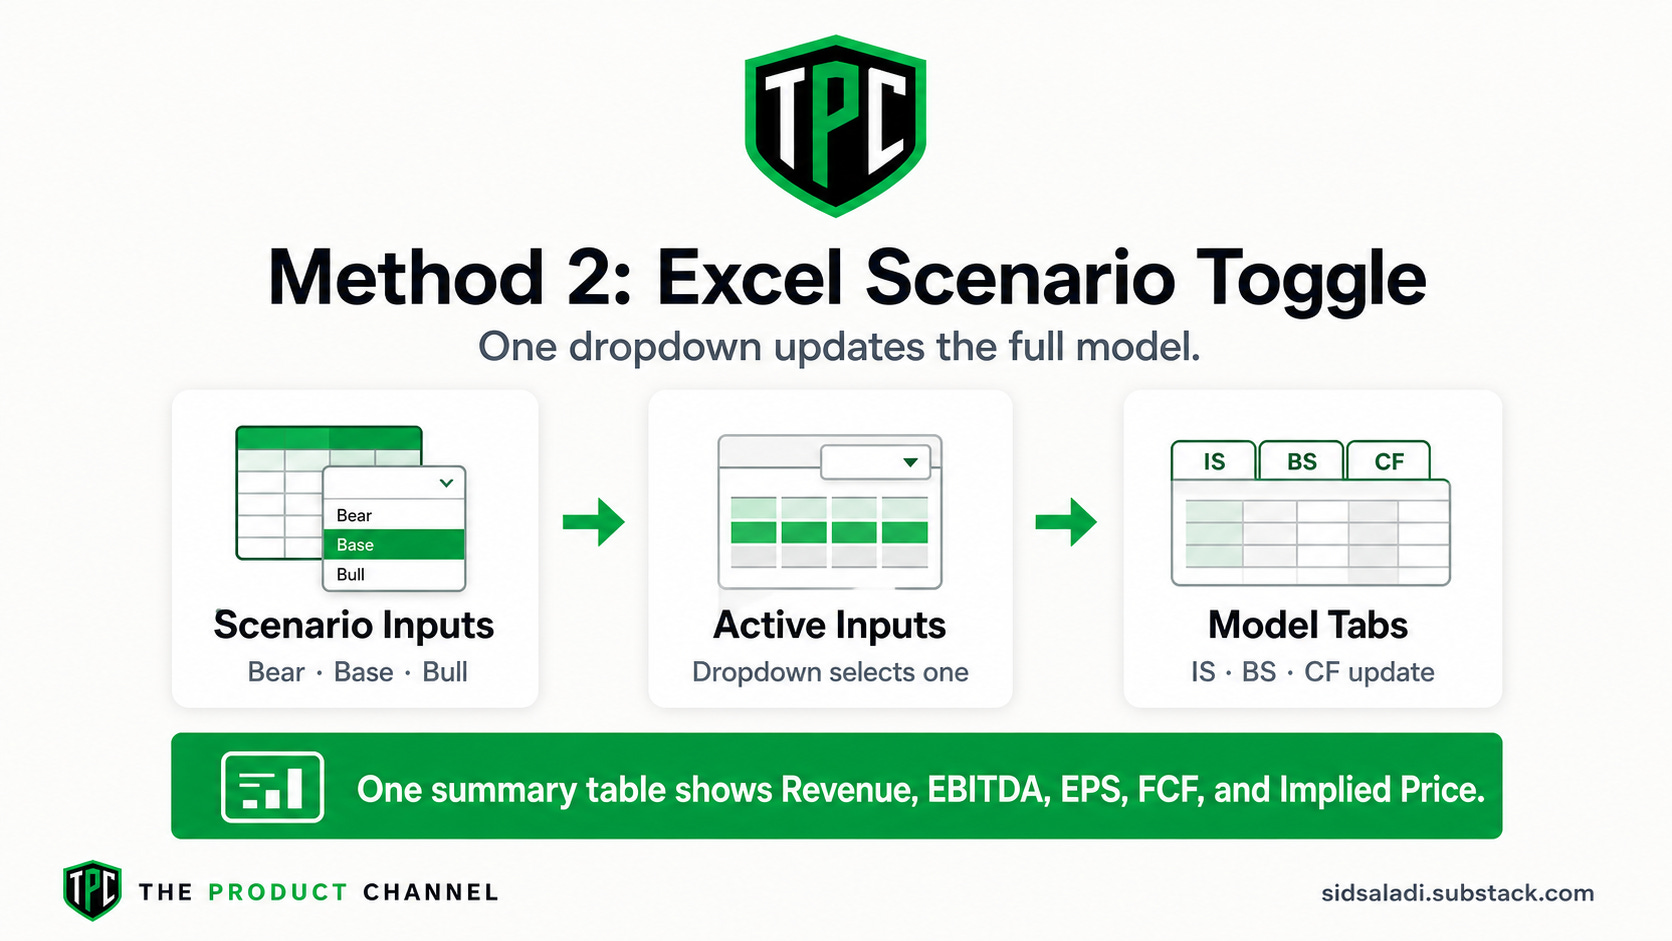
For deliverables that need to live in Excel — which is most finance work — you want a proper scenario model. Not three separate files. One file with a scenario selector that instantly refreshes the entire model.
The Architecture
The cleanest approach is a three-layer system:
Assumptions tab: Three scenario columns side-by-side (Bull / Base / Bear), with a dropdown selector at the top
Active Assumptions tab: Pulls from whichever scenario column is selected — this is what every other tab references
Model tabs: Income Statement, Balance Sheet, Cash Flow all reference only the Active Assumptions tab
Change the dropdown from “Base” to “Bull” and every linked cell in every sheet updates simultaneously. No manual toggling. No copying and pasting ranges. No version confusion.
Build Prompt
Run this after you’ve already built your 3-statement base model (from Article 2):
Take the 3-statement model we've built and add scenario analysis
infrastructure.

SCENARIO ARCHITECTURE:
1. Create a new "Scenario Assumptions" sheet with columns:
   - Column A: Assumption name / label
   - Column B: FY historical average (reference from historical data)
   - Column C: BEAR CASE inputs (blue cells)
   - Column D: BASE CASE inputs (blue cells) — same as current assumptions
   - Column E: BULL CASE inputs (blue cells)
   - Column F: Rationale for each scenario assumption

2. Create a "Active Assumptions" sheet that uses an INDEX/MATCH
   formula to pull from Bear, Base, or Bull column based on a
   dropdown cell at the top (named cell: "ScenarioSelector").
   Dropdown options: Bear Case | Base Case | Bull Case

3. Update ALL existing model sheets (IS, BS, CF, schedules) to
   reference "Active Assumptions" instead of the old assumptions tab.

SCENARIO DEFINITIONS for [Company]:

BEAR CASE (defensive assumptions):
- Revenue growth: [X-5]% below base
- Gross margin compressed by [Y]bps due to tariffs / competition
- Higher R&D spend as % of revenue (investing through downturn)
- Higher effective tax rate
- CapEx maintained (can't cut investment)
- Minimal buybacks (preserve cash)

BASE CASE (current trajectory):
- [Use the assumptions we've already developed]

BULL CASE (upside scenario):
- Revenue growth: [X+5]% above base
- Margin expansion from Services mix shift
- Operating leverage on fixed costs
- Aggressive buybacks continue
- Multiple expansion justified

FORMATTING:
- Add a scenario summary box at the top of the cover sheet
  showing current active scenario in bold
- Color-code scenario headers: Red = Bear, Blue = Base, Green = Bull
- Add a "Scenario Outputs" summary table showing Revenue, EBITDA,
  Net Income, EPS, FCF, and Implied Price for ALL THREE scenarios
  side-by-side — so you can see the full range at a glance
- Export updated model as .xlsx
The Scenario Summary Table
The output you actually present is the scenario summary. It looks like this — all three scenarios side by side so your audience immediately sees the range of outcomes
Claude builds this directly into your Excel cover sheet. It’s the one page you show in a board presentation.
Method 3: Claude in Excel Plugin (The Most Powerful Workflow)
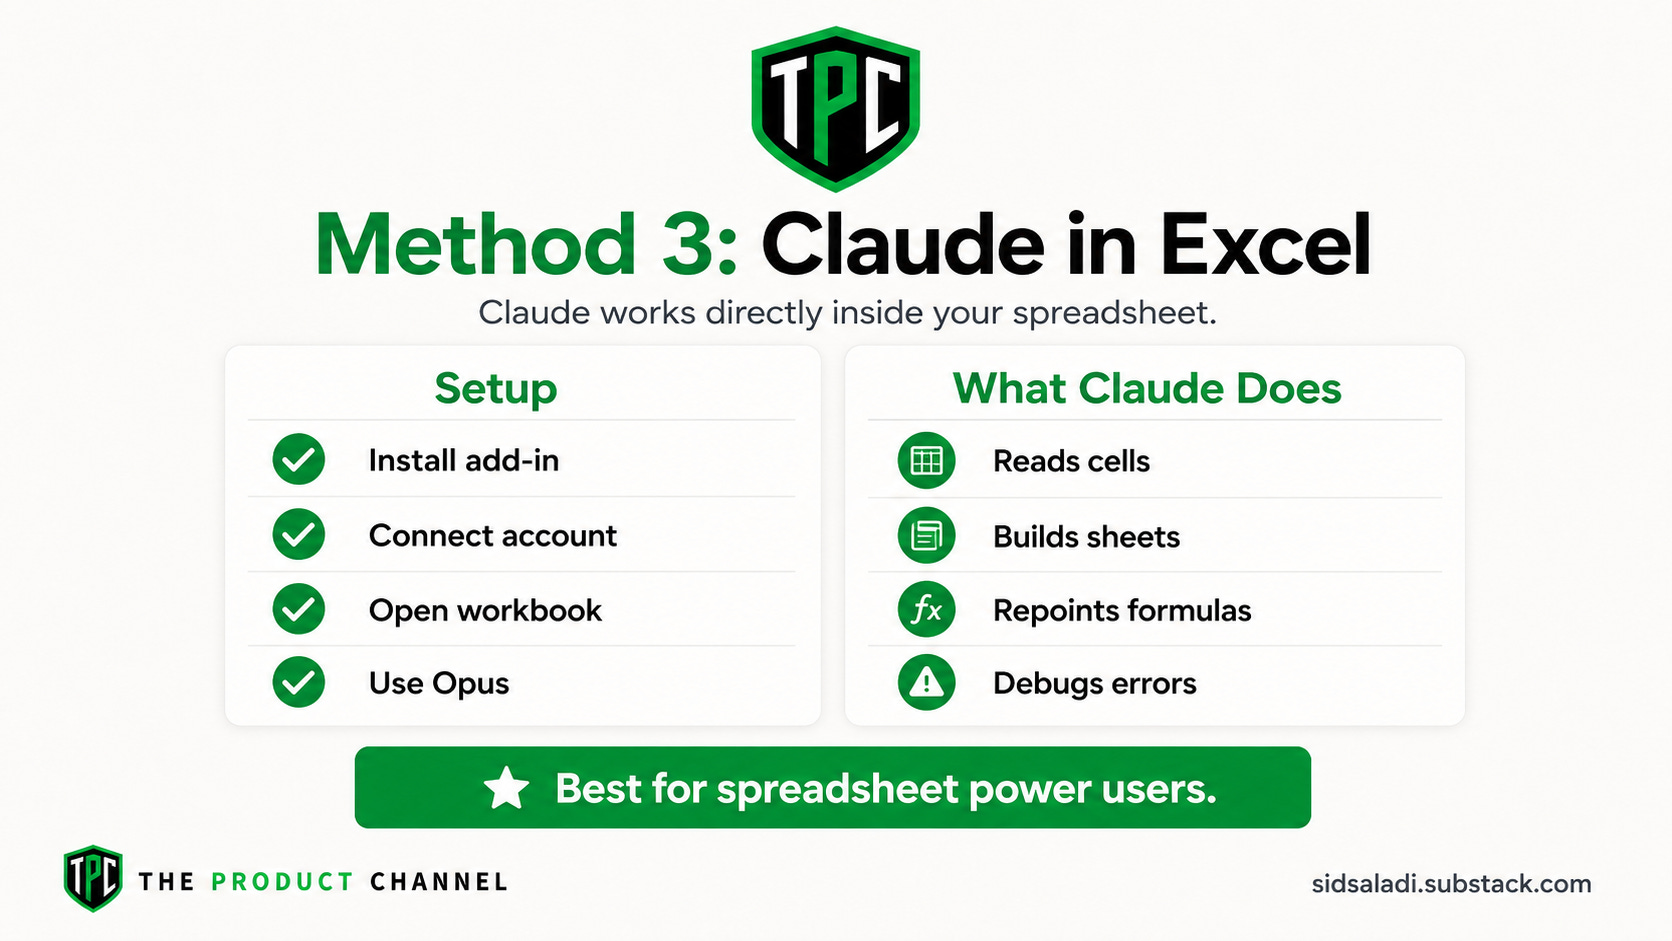
This is for users on Claude Team or Enterprise plan. Claude integrates directly into Excel as a plugin — you prompt Claude inside your spreadsheet, and it edits cells, builds formulas, adds tabs, and formats everything without ever leaving Excel.
No copy-pasting. No downloading. No round-tripping between browser and spreadsheet. Claude works live in your file.
Setup (15 minutes, one time)
In Excel, go to Insert → Add-ins → Get Add-ins
Search “Claude in Excel” and install
The Claude panel appears in the right sidebar
Connect your Anthropic account when prompted
Select Opus 4.6 in the model dropdown — for complex model work, use Opus
Once connected, the plugin shows you three things it can do: analyze your data, build financial models, and debug errors. All three are genuinely useful.
Building a Scenario Analysis Directly in Excel
Open the 3-statement model you built in Article 2. With the Claude panel open:
I have a 3-statement financial model in this workbook. I need to
add scenario analysis infrastructure.

Current structure:
- Sheet "Assumptions" has my base case inputs
- Sheets "IS", "BS", "CF" all reference the Assumptions sheet

What I need:
1. Add a new sheet "Scenario Manager" with:
   - A dropdown in cell B2 to select: Bear / Base / Bull
   - Bear case assumption columns (based on -15% to -25% revenue
     sensitivity, margin compression, minimal buybacks)
   - Base case columns (copy from current Assumptions sheet)
   - Bull case columns (revenue upside, margin expansion,
     aggressive capital return)

2. Add a new sheet "Active Inputs" that uses INDEX/MATCH to pull
   from whichever scenario column is active per the B2 dropdown

3. Repoint all formula references in IS, BS, and CF from
   "Assumptions" to "Active Inputs" — every cell that currently
   says =Assumptions!B5 should become =Active_Inputs!B5

4. Add a Scenario Summary table on the cover sheet showing all
   three scenarios side by side for key metrics

Please proceed with building this. I'll approve each set of
changes as you go.
When Claude asks permission to make changes, click Allow for all edits in this session. It will then work through the spreadsheet systematically — you’ll see cells updating in real time.
What Makes This Different
The Excel plugin gives you something the browser workflow doesn’t: Claude can see your actual cell values, formula errors, and structural issues in real time.
If a formula is returning #REF!, Claude spots it and fixes it without you pointing it out. If two cells that should match don’t, Claude finds the discrepancy and traces it back to the source.
It also means you can do things like:
Look at my assumptions sheet. My revenue growth assumption for FY27
seems inconsistent with the DPO assumption I have in working capital.
Can you verify these are internally consistent, and flag any other
assumption inconsistencies you find across the model?
Claude will scan across sheets and surface conflicts you might have missed.
Building a Sensitivity Analysis Table
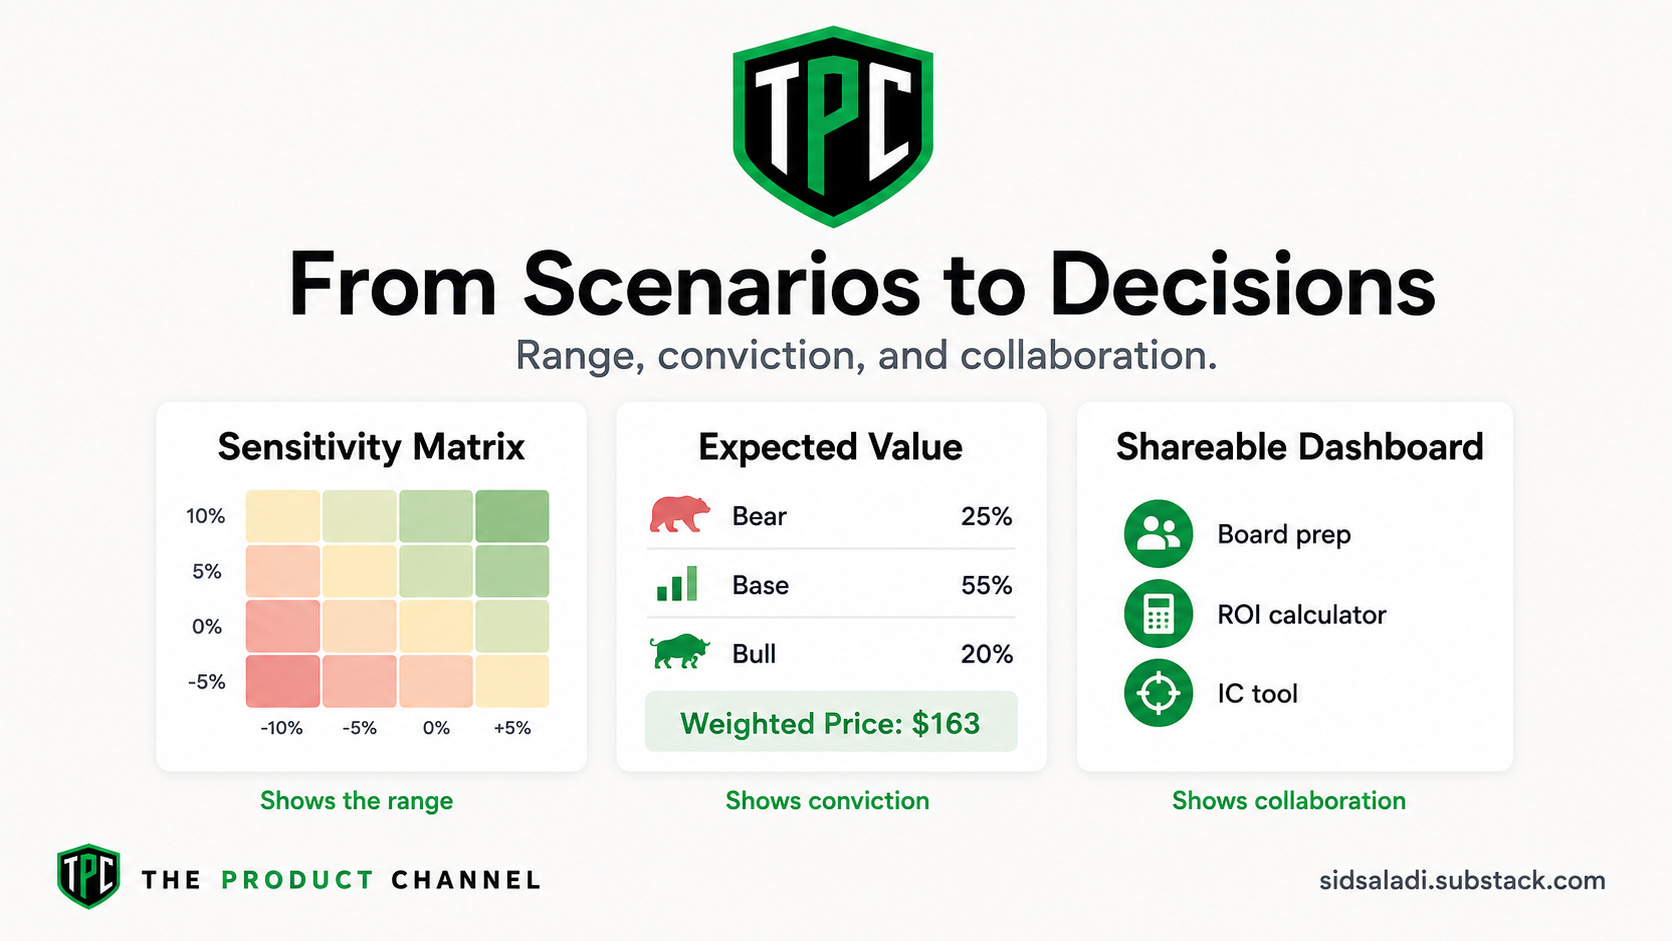
Scenario analysis gives you three named outcomes. Sensitivity analysis gives you a continuous range.
The standard format is a two-variable sensitivity matrix — usually WACC vs. terminal growth rate for a DCF, or revenue growth vs. margin for an operating sensitivity.
Build a sensitivity analysis for my [Company] DCF valuation.

Create a 2D sensitivity table showing implied share price at:

WACC (rows): 7%, 8%, 9%, 10%, 11%, 12%
Terminal Growth Rate (columns): 1.5%, 2.0%, 2.5%, 3.0%, 3.5%

Format as a 6x5 matrix with:
- Current base case WACC and terminal growth rate highlighted
  with a border
- Conditional formatting:
  Green fill if implied price > current share price ($[X])
  Yellow fill if within ±10% of current price
  Red fill if implied price < current price minus 10%
- Include a second sensitivity table below:
  Revenue Growth (rows) vs. EBITDA Margin (columns)
  showing implied FY+3 EPS

Add both tables to a new "Sensitivity" sheet in the model.
Export updated file.
The output is the classic football field chart that every equity research report and investment committee deck uses.
Making Your Dashboard Shareable
One thing that doesn’t get talked about enough: Claude artifacts are public links.
When you build the interactive scenario dashboard in Method 1 and publish it, you get a URL that anyone can open. No login. No Claude account. Just a browser.
Practical uses:
Send a scenario model to a founder before a board meeting — they can stress-test assumptions live
Share an ROI calculator with a client before a proposal call
Give your investment committee a live sensitivity tool for a deal
Send a business case dashboard to a CFO who wants to poke at the numbers themselves
The shareable artifact becomes a collaboration tool, not just a deliverable. That changes how meetings work.
The Mistake Most People Make With Scenario Analysis
Here’s what I see constantly: analysts build three scenarios and present them as if they’re equally likely.
They’re not. And your audience knows they’re not.
The more useful frame is expected value.
I have three scenarios for [Company]:
Bear Case: $[X] implied price — probability [A]%
Base Case: $[Y] implied price — probability [B]%
Bull Case: $[Z] implied price — probability [C]%

Add an expected value calculation to my scenario summary:
- Probability-weighted implied share price
- Upside vs. downside skew (how much more upside vs. downside)
- Probability of achieving at least [current price] return
- What probability would you need to assign to the Bull Case
  for the investment to make sense at current prices?

Present as a 1-page investment thesis summary.
This reframes scenario analysis from “here are three outcomes” to “here’s what I actually think.” That’s the kind of output that gets acted on.
What’s Next
Article 4: 100+ Claude Prompts for Financial Analysis (every prompt organized by use case — valuation, credit analysis, equity research, FP&A)
Article 5: Advanced Claude Finance Workflows (MCP integrations, multi-company batch analysis, custom skills for your firm’s templates)
📚 Dive Deeper: Financial Modeling & AI Tools